New York City

About New York City |
Storm Surge History |
|
The Tampa Bay area was inhabited by Native Americans for thousands of years. Modern-day Tampa has a population of approximately 336,000 people (2010 Census). Port Tampa Bay is the oldest in the state of Florida, being built and opened in 1924. U.S. Census Data estimates a population growth of approximately 2.47% yearly. Given its location along the Gulf of Mexico, Tampa's economic impact on the state of Florida and the United States is very significant.
|
U-Surge provides high water marks from # hurricanes and tropical storms at New York city (The Battery), NY since YEAR. Hurricane NAME (YEAR) generated the highest storm tide on record, as the water level reached # ft above the Annually-Adjusted MSL (AAMSL). Hurricane NAME's (YEAR) #-ft storm tide reached second place;
|
Infographics
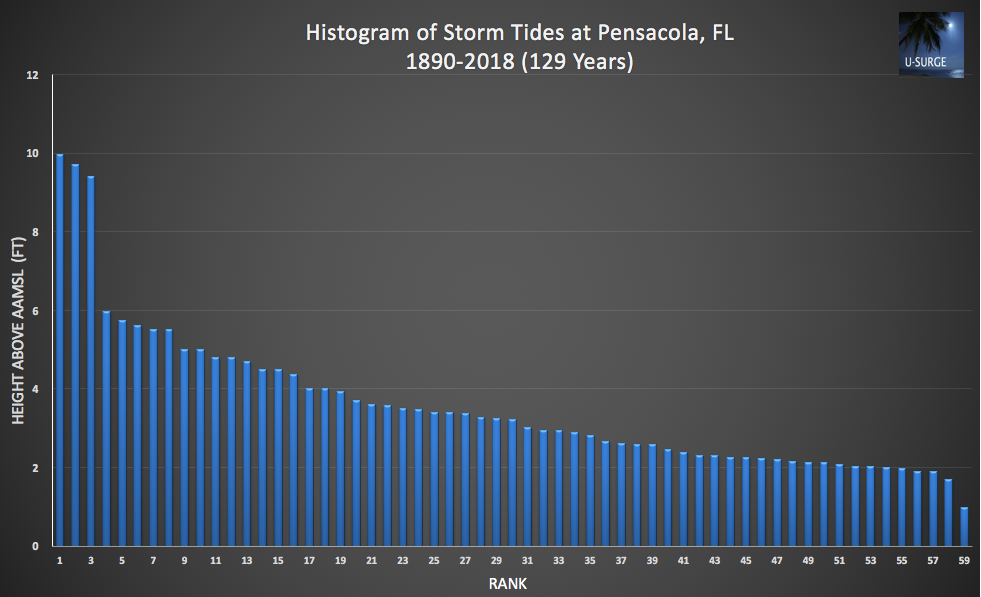
This histogram provides the maximum water levels of the 59 recorded storm tide events at Pensacola since 1890. The events are ordered from the highest water level (Rank = 1) to lowest (Rank = 59). These events are not placed in chronological order. All data are detrended to remove the influence of relative sea level rise, so they represent water levels above an Annually-Adjusted Mean Sea Level (AAMSL).
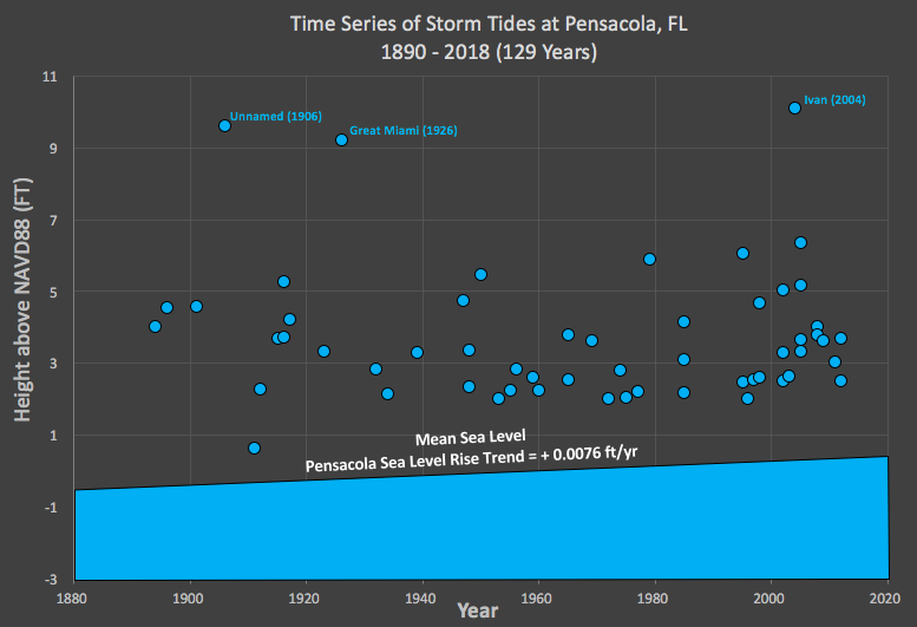
This time series provides maximum water levels from 59 recorded storm tide events at Pensacola since 1890. These events are ordered chronologically from oldest (left) to newest (right). The numerous low-magnitude events in recent decades are influenced by both climate and data availability. All data are converted to NAVD88 datum, however, the data are intentionally not detrended, so the influence of relative sea level rise is included. SLR trend taken from NOAA tide gauge at Pensacola.
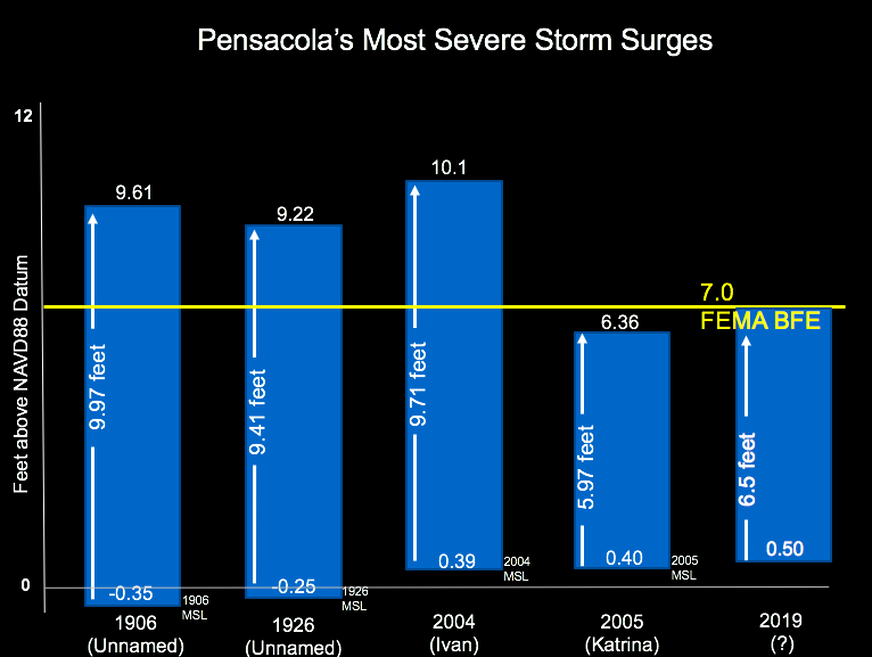
Graph of the four most severe storm surge events at Pensacola, as well as the amount of water (6.50 feet) needed for a 2019 storm to reach FEMA's BFE, considering the annual Mean Sea Level (MSL).
Statistics/ Return Period
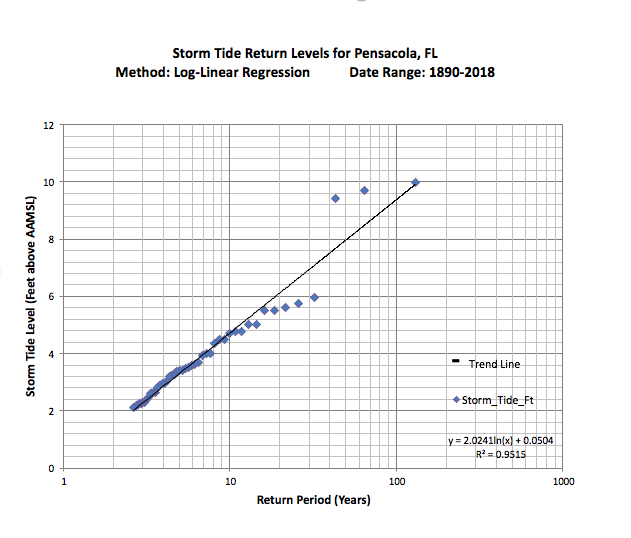
Storm tide return levels graph for Pensacola. This graph uses a log-linear regression plot based on observed data from 1890-2018 (129 years). The graph uses the Weiboll Plotting Position Formula, whereby the probability of an extreme event occurring is Rank/ (n+1), where "n" is the number of years in the data record. These data have been detrended to remove the influence of sea level rise and all data are plotted relative to Annually Adjusted Mean Sea Level (AAMSL). The regression line represents the line of best fit and indicates return levels (y-axis) for various return periods (x-axis).
Return Period |
Storm Tide Level (Feet above AAMSL) |
500-year |
12.63 |
200-year |
10.77 |
100-year |
9.37 |
50-year |
7.97 |
25-year |
6.57 |
10-year |
4.71 |
Extreme water levels above Annually-Adjusted Mean Sea Level (AAMSL) with long-term sea level rise removed. The correct way to interpret these levels is as follows: Based on a log-linear regression of observed data from 1890-2018, storm tide levels at Pensacola should equal or exceed 9.37 ft every 100 years, on average, above the annually-adjusted MSL. According to the regression equation, the 1906 Hurricane's 9.97-ft storm tide was a 135-year event and Hurricane Ivan's (2004) 9.71-foot storm tide was a 118-year event.
Sea Level Rise and Future Extreme Water Levels
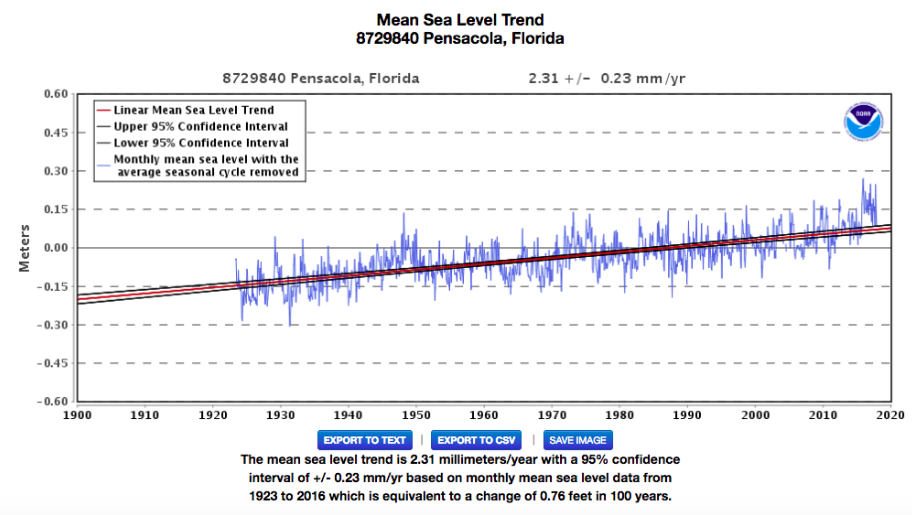
Long-term SLR graph for Pensacola, Florida. The long-term rate of SLR is 0.76 feet/century.
Source: https://tidesandcurrents.noaa.gov/sltrends/sltrends_station.shtml?stnid=8779770.
Source: https://tidesandcurrents.noaa.gov/sltrends/sltrends_station.shtml?stnid=8779770.
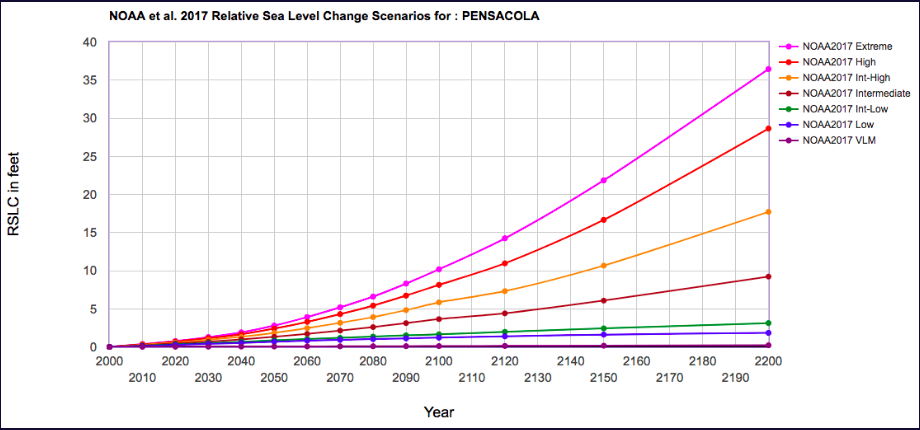
Graph of SLR scenarios for Pensacola, Florida, from NOAA et al. (2017). The CorpsClimate web-tool developed by the U.S. Army Corps of Engineers provided this graph. Data revised July 18, 2017. Available on the Web at: http://corpsclimate.us/ccaceslcurves.cfm.
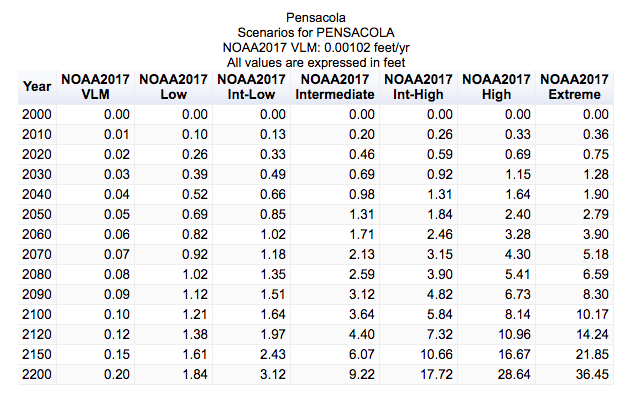
Table of SLR scenarios for Pensacola, Florida, from CorpsClimate web-tool developed by U.S. Army Corps of Engineers.
Data from this table revised July 18, 2017. Available on the Web at: http://corpsclimate.us/ccaceslcurves.cfm.
Data from this table revised July 18, 2017. Available on the Web at: http://corpsclimate.us/ccaceslcurves.cfm.
Year |
100-Year Flood Intermediate SLR |
100-Year Flood Intermediate-High SLR |
2000 |
9.73 |
9.73 |
2020 |
10.19 |
10.32 |
2040 |
10.71 |
11.04 |
2060 |
11.44 |
12.19 |
2080 |
12.32 |
13.63 |
2100 |
13.37 |
15.57 |
This table provides future 100-year water levels above NAVD88 datum. These numbers are calculated by adding four values: 1) The 100-year storm tide listed in the Statistics/ Return Period section- measured in feet above AAMSL; 2) An adjustment from MSL to NAVD88, which involved adding 0.30 ft to all water levels for Pensacola; 3) A conversion from water levels in 1992 (the mean year of the Present Epoch for Pensacola tide gauge data) to 2000, based on a long-term SLR rate of 0.76 ft/ century, which meant adding 0.06 ft; 4) Sea-Level rise projections from NOAA (2017), shown in the Future SLR Graph and Table above.
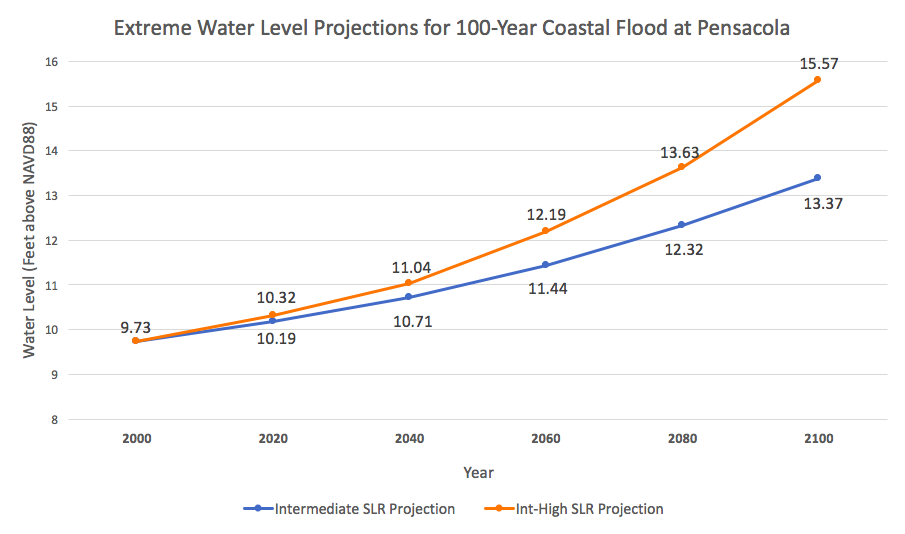
Extreme water level predictions for the 100-year coastal flood event at Pensacola. All of these projected values pertain to water levels for the "100-year storm" (1% annual chance) in the future. This analysis assumes stationarity in the flood level above the Annually Adjusted Mean Sea Level (AAMSL), so the increase in values are completely due to sea-level rise. According to this graph, there is a 1% chance that water levels will equal or exceed 12.19 feet in the year 2060, according to the intermediate-high SLR projection. These values do not account for wave action in velocity zones.
Data Sources
|
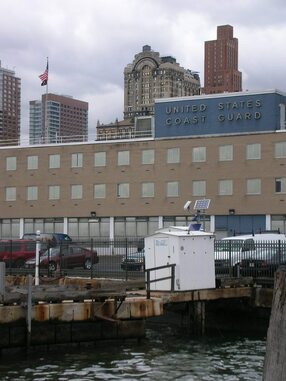
Tide Gauge Site: New York (The Battery), NY 8518750
Operation: National Ocean Service (NOS) Coordinates: Lat: 40.700028 Lon: -74.013339 6-Min Water Level Data November 30, 1995 - Present Hourly Water Level Data June 1, 1920 - November 30, 1921 November 20, 1926 - Present The NOS tide gauge at The Battery, NY provides verified hourly data since 1920 and verified 6-min data since 1995. |
|
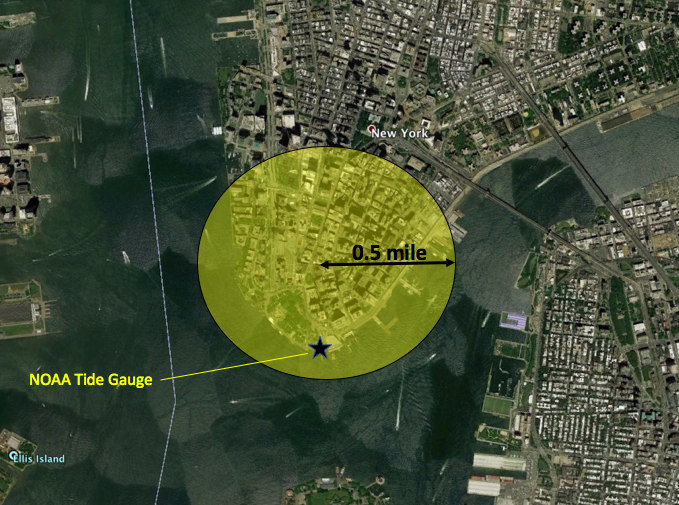
New York City's U-Surge data come from within a circle with one-half mile radius and centered on Lower Manhattan. This area includes NOAA's tide gauge at The Battery, which provides an almost continuous record of hourly water levels since 1926. This data-selection circle is centered on lat: 40.7062, lon: -74.0126.
Missing Data
We have identified five hurricanes/ tropical storms since 1900 that may have generated storm tides exceeding 4 ft (1.22 m) near Pensacola, but a literature review does not yet provide data. These maps are provided by Unisys Corporation
Storm Surge Multimedia
Note: All of these pics/videos were taken from the 5 boroughs of NYC
Hurricane Irene (2011)
Nice storm surge video at Pensacola. At 51 seconds into the video do you see evidence of a nice rip current pushing offshore? Look for elongated area of white water perpendicular to the coast. Any coastal experts want to confirm this?
Hurricane Donna (1960)
Excellent video of storm surge inundation in the Rockaways (Queens Borough) area of New York City.